
• Skip to main content
  • Skip to secondary menu
  • Skip to primary sidebar
  • Skip to footer
Geographical

Geographical

Official magazine of the Royal Geographical Society (with IBG)

  • Geographical Home
  • News
  • Features
  • Opinion
    • Climatewatch
    • Front Lines
  • Podcast
  • Travel
    • Discovering Britain
    • Passport
  • Culture
    • Book reviews
  • Quizzes
    • Crosswords
  • Choose Geography
    • University directory
    • Masters courses
    • Course guides
      • Climate change
      • Environmental science
      • Human geography
      • Physical geography
    • University pages
      • Aberystwyth University
      • Brunel University
      • Cardiff University
      • University of Chester
      • Edge Hill University
      • The University of Edinburgh
      • Newcastle University
      • Nottingham Trent University
      • Oxford Brookes University
      • The University of Plymouth
      • Queen Mary University of London
    • Geography careers
      • Charity/non-profit
      • Education & research
      • Environment
      • Finance & consulting
      • Government and Local Government
    • Applications and advice
  • Magazine
    • Issue previews
    • Subscribe
    • Manage My Subscription
    • Special Editions
    • Geographical Archive
    • Advertise with us
  • Subscribe
    • Direct Debit Changes

British cities most vulnerable to extreme heat revealed in new study

8 September 2026
3 minutes

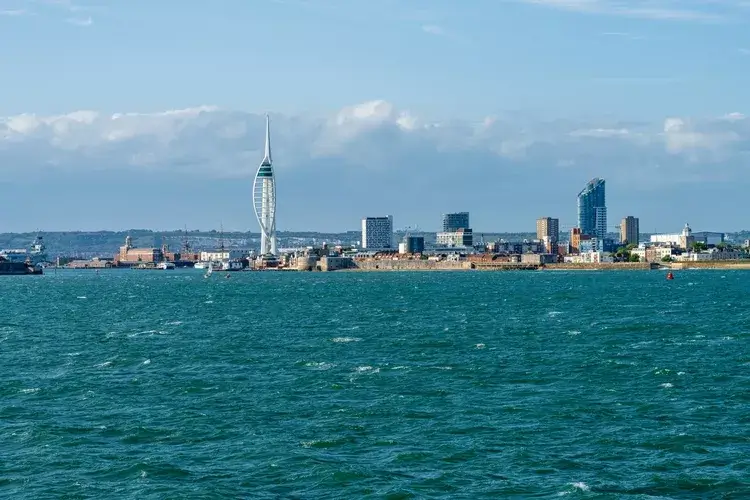
Spinnaker Tower dominates the Portsmouth skyline, overlooking the harbour in Portsmouth England seen from departing ferry
Portsmouth, pictured above, is most at risk of urban heat. Image: Steve Heap/Shutterstock

83 per cent of British cities are highly vulnerable to heat, with Portsmouth most at risk, new analysis finds


By Victoria Heath

New analysis conducted by Ordnance Survey (OS), the Met Office and 4 Earth Intelligence has revealed the cities most vulnerable to urban heat in Britain.

It found Portsmouth, Leicester, Exeter, Nottingham, Brighton and Bristol are among the cities that will warm the most by 2100 due to the ‘urban heat island’ phenomenon.

This occurs when buildings, roads and surfaces absorb heat during the day, making cities much warmer than rural areas. The very infrastructure of cities also exacerbates the urban heat island effect: tall buildings and narrow streets reduce wind speeds that would carry heat away, and a lack of trees reduces the natural cooling effects of shade.


Enjoying this article? Check out our related reads…

  • London’s first heat plan launched to tackle rising temperatures
  • The most vulnerable world heritage sites threatened by climate change
  • What cities can do to combat rising heatwaves
  • Geo explainer: What is a heat dome, and is it different to a heat wave?
  • Geo explainer: What are urban heat islands?

Increased heat vulnerability in a city can lead to human health risks, especially for older individuals and babies. Extreme urban heat will also place additional pressure on transport networks, public services, workplaces and homes.

In total, 59 cities in Britain (83 per cent) are highly vulnerable to urban heat, while the remaining 12 cities (17 per cent) are classified as moderately vulnerable.

In particular, Leicester is projected to see the largest increase in heat vulnerability rankings, from 10th in 2026 to 4th by the end of the century. The most heat-vulnerable city today was Portsmouth, due to its highly built-up urban environment, followed by Carlisle and the City of Westminster. In both near-term and long-term projections, the City of Westminster ranks second.

The City of London recorded the least effective natural cooling of any city in the study, due to its combination of buildings, roads, and constructed surfaces, with limited green spaces, trees, and water.

The organisations behind the new analysis developed a Heat Vulnerability Index to rank how climate breakdown-related heat will affect urban areas, finding that by 2040, ‘rising summer temperatures are projected to push every city into the high vulnerability category’. By 2100, 45 cities (63 per cent) will cross into severe heat vulnerability, the ‘most serious level in the index’, the analysis warned.

Big Ben with person in front with umbrella
In both near-term and long-term projections, the City of Westminster ranks second in the heat vulnerability index. Image: Shutterstock

The analysis comes after the Met Office announced that the UK’s summer was provisionally the hottest on record, with an average mean temperature of  16.5°C. In mid-August, three-quarters of England were officially in drought.

Previously, scientists have studied the impacts of the urban heat island effect. In 2025, The Lancet Planetary Health reported that around 399 of the 785 heat-related deaths in Greater London during the summer of 2018 were attributable to the urban heat island effect rather than to background temperatures alone.

‘What the Index shows is that the severity of urban heat islands is not uniform, and the cities most at risk of overheating during a heatwave are places where the built environment has grown at the expense of the natural one,’ said CEO of Ordnance Survey Nick Bolton.

‘Location-based insights like this have a critical role to play in evidence-based decision-making. They show where exposure is greatest as temperatures continue to rise, which of a city’s existing green and blue spaces need protecting, and where different interventions could have the highest impact in protecting communities and strengthening national resilience.’

Themes News

Protected by Copyscape

Primary Sidebar

SUBSCRIBE

GEOGRAPHICAL WEEKLY LOGO FREE - Sign up to get context, clarity and perspective in a noisy world, every Friday

Popular Now

On The Ground: The Aberfan Tribunal

On The Ground: The Aberfan Tribunal

Shompen band traversing a river on Great Nicobar Island.

UN urges India to suspend controversial mega-project on Great Nicobar Island

3d globe inside digital scanning frame.

AI or climate change – which poses the greater threat to humanity?

Copernicus Marine Service visualisations show the impact of Super Typhoon Champi on the Philippine Sea on 21 October 2026. With winds reaching 296 km/h, the Category 5 storm was the strongest tropical cyclone recorded in 2026. The images show the anticlockwise movement of wind-generated waves (left) and significant wave heights reaching 10 metres near the storm’s centre (right).

Typhoon Champi hits Taiwan

Yemen displacement

Thousands of people forced to flee Yemen to Djibouti as conflict escalates

Footer

  • Facebook
  • Instagram
  • LinkedIn
  • Reddit
  • TikTok
  • Twitter
  • YouTube

Geographical print magazine cover

Published in the UK since 1935, Geographical is the official magazine of the Royal Geographical Society (with IBG).

Informative, authoritative and educational, this site’s content covers a wide range of subject areas, including geography, culture, wildlife and exploration, illustrated with superb photography.

Click Here for SUBSCRIPTION details

Want to access Geographical on your tablet or smartphone? Press the Apple, Android or PC/Mac image below to download the app for your device

Footer Apple Footer Android Footer Mac-PC

More from Geographical

  • Subscriptions
  • Get our Newsletter
  • About Us
  • Contact Us
  • Advertise with us
  • Privacy policy
  • Terms & Conditions

Copyright © 2026 · Site by Syon Media