Seabed 2030 aims to map the entirety of the ocean floor by 2030, but is it a possible endeavour – and what has been mapped so far?
By
The sea is a nebulous cavern, of which more than 80 per cent is both unexplored and unmapped. Detailed maps have been made of the Moon and Mars, but no comprehensive map has been created of the entirety of the ocean floor – yet.
To combat this, an international collaboration, known as the Seabed 2030 project, is underway between the General Bathymetric Chart of the Oceans and the Nippon Foundation.
Enjoying this article? Check out our related reads…
With the aim of mapping the entire ocean floor by 2030, the Seabed 2030 project has an ambitious goal of closing one of the largest data gaps in ocean science. It is hoped that such data will enable improved natural-disaster preparedness (e.g., tsunami warnings) and the planning of deep-sea cable locations. It’s also pivotal for understanding the biodiversity that may inhabit the depths of the world’s oceans.
But, what has Seabed 2030 mapped so far? And why is it useful to map our ocean’s floors?
How is the seafloor mapped?
To begin, it’s important to understand exactly how the project maps the seafloor. Seabed 2030 utilises multibeam sonar, an active sonar system that detects objects in the water column along the seafloor. The multiple physical sensors of the sonar send and receive sound pulses that map the seafloor or detect other objects.
Computers on the ship then collect this data, and scientists process it to create water-depth maps that help visualise the seafloor. Warmer colours (red and orange) typically correspond with shallower areas, while cooler colours (yellows and greens) indicate deeper areas.
A range of research institutes, navies, private companies and governments are carrying out the project. These include the General Bathymetric Chart of the Oceans and the Nippon Foundation, as well as regions overseen by Seabed 2030 centres (covering the Southern Ocean, Arctic, Atlantic, Pacific, and Indian Oceans).
Seabed 2030 also utilises crowd-sourced bathymetry. Essentially, this refers to commercial vessels – such as yachts, fishing boats and trawlers – passing through under-surveyed areas and utilising radar technology to map the seabed floor at the same time.
What exactly has been mapped so far?
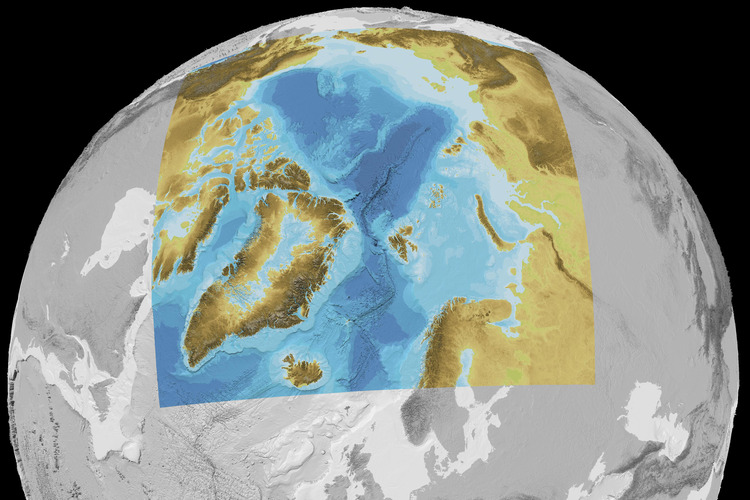
Last year, Geographical reported that a significant quantity of data had been added to the Seabed 2030 project’s ocean floor survey. A further portion of the Arctic Ocean had been mapped, adding 1.4 million square kilometres of mapping coverage – an area more than three times the size of Sweden – to the project.
Traditionally, perennial sea-ice cover, along with extreme conditions, has meant that data collection in the Arctic Ocean has been extremely limited; however, advances in technology and computing have enabled scientists to map this region in great detail.
As of June 2025, the project had mapped 27.3 per cent of the world’s ocean floor, announcing it had increased its total data by more than four million square kilometres of newly mapped seafloor – an area roughly equivalent to the entire Indian subcontinent.
Well-mapped areas include the North Atlantic, coastal waters of developed nations such as the US, Japan and Norway, parts of the Pacific – such as some island EEZs, and regions surveyed during scientific endeavours, and the Southern Ocean.
The biggest gaps remain in the central Pacific abyssal plains, parts of the Indian Ocean, remote areas of the Southern Ocean, deep ocean basins far from shipping routes and some parts of the South Atlantic. These are expensive to survey, and lack commercial incentives to do so.
Even though 27.3 per cent has been mapped to a high resolution, nearly 100 per cent has low-resolution satellite-derived bathymetry.
Why is mapping the seafloor important?
The aim of high-resolution mapping, like the Seabed 2030 project, is beneficial in many ways: from ensuring the safety of marine activities – like ships passing through ocean waters, and underwater resource extraction – to monitoring how marine life and habitats change over time. The goal is ambitious, but as governments and other organisations collaborate together, it is hoped the project can be completed on time.
Currently, many navigational products rely on data recorded back in the 19th century, which used rowing boats with lines and lead weights. Updating this data will ensure that ships use routes that are safe for generations to come.
Mapping the seafloor also offers a great way to keep stock of ocean resources. For example, if resources such as new medicines, rare metals, and others are continually extracted before their exact quantities can be fully determined, there is a real risk of depleting vital resources and permanently damaging the marine habitats in which they occur.
Another benefit of seafloor mapping is making global prediction models more accurate, such as those which forecast weather, climate and tsunami impact zones.
However, there is one significant problem that extensive mapping can cause, and that’s pollution – not just from fuels used by ocean vessels as they trawl through deep waters, but also undersea noise pollution that can impact communication between cetaceans and disorientate many species of marine life.
One way to address this issue is to develop autonomous vessels that can operate without fossil fuels and without crew, and to train local practitioners in data management, surveying, and processing, so that environmental damage can be mitigated through data mapping.
Will mapping the entire seafloor be possible?
Mapping the entire seafloor is technically possible, but whether it can be achieved by 2030 is another question.
GEBCO has estimated that if just one ship using current multibeam technology attempted to map the ocean alone, it would take hundreds to more than 1,000 years. This illustrates that mapping is possible – but only through coordinated international efforts.
However, of course, cost is a major factor in mapping the seafloor. Survey vessels are costly to operate, remote regions require long expeditions and harsh conditions – particularly in the Southern Ocean and Arctic – reduce mapping windows.
Ultimately, achieving Seabed 2030 on time relies on several factors: data aggregation, crowd-sourced bathymetry, autonomous vehicles and international hydrographic offices contributing data. The biggest gains so far have come from previously collected data being shared, not just new mapping missions.