Immigration to US is at its highest-ever rate since records began – discover the top five countries from which migrants to the US come from
By
Home to one-fifth of the world’s international migrants – the largest population of immigrants in the world – the US is a vibrant and eclectic mix of cultures, backgrounds and ethnicities from across the world, owing much of its cultural development and population growth to immigration. Today, immigrants account for 15.2 per cent of the US’s total population, increasing by roughly threefold from 4.7 per cent back in 1970.
Since 2021, the US has experienced its largest-ever recorded surge in immigration (even after adjusting to today’s larger population), surpassing levels in the 1800s and early 1900s when millions of Europeans arrived to the country’s shores.
Estimates suggest that over the last four years, it is likely that net migration – the number of people coming to the country minus the number leaving – has exceeded eight million people, a number including both legal and illegal migrants. Of these eight million people, around 5 million (62 per cent) entered the country illegally.
Despite the uptick in immigration, analysis suggests that this recent surge has likely ended. Combined with Biden’s tightening immigration regulations that took effect last summer, Trump’s promises of even tighter border control could become a sizeable impact on numbers if such measures are given the go ahead.
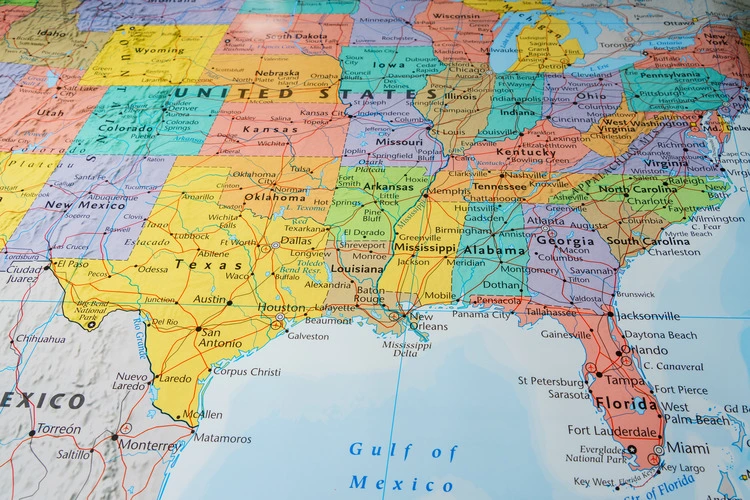
But which countries have been driving migration to the US? Here we reveal the top five countries of birth for immigrants living in the US according to the most recent data, in reverse order:
5) El Salvador (3 per cent)
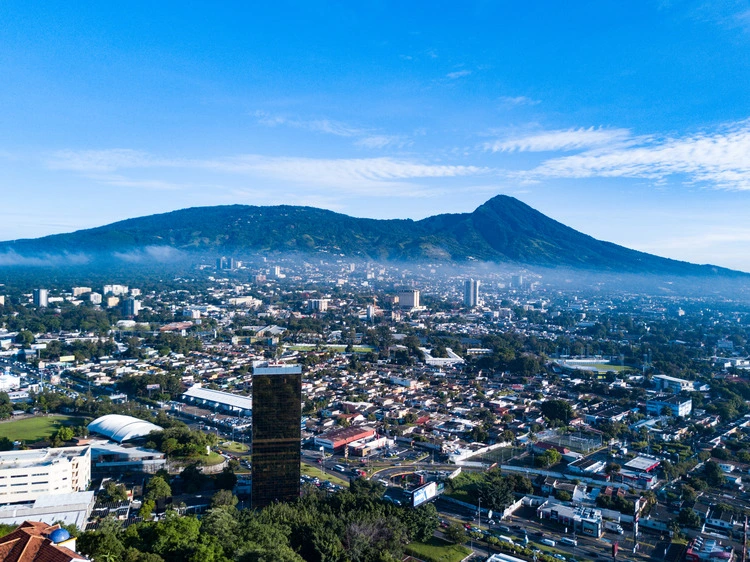
1.4 million immigrants in the US were born in El Salvador, a population that has grown rapidly since 1980 when just 95,000 Salvadoran immigrants lived in the country. The largest numbers of immigrants from El Salvador live in the states of California (415,000), Texas (170,000) and New York (105,000), and on a city-level, the highest proportion of Salvadoran immigrants reside in Los Angeles (275,000).
Enjoying this article? Check out our related reads:
Other key metropolitan areas for Salvadoran immigrants are Washington DC New York City and San Francisco.
Following a series of major earthquakes in El Salvador back in 2007 that led to devastating impacts including 1,100 deaths and 7,900 injuries, around 217,000 Salvadoran immigrants were given an extended Temporary Protected Status (TPS), granting them temporary humanitarian protection and work authorisation in the US. But crucially, TPS does not lead to an individual gaining permanent resident status or US citizenship.
The US continued to support the vital lifeline of TPS for eligible Salvadoran immigrants until 2019, when the decision was announced to terminate the scheme.
Such a decision led to two lawsuits – which are still ongoing – meaning that the termination of TPS cannot take effect yet. The decision to terminate TPS caused controversy amongst Salvadoran immigrants, since roughly 171,100 of those who have TPS are currently working in the US, mainly in the construction, restaurant and food service, and landscaping industries. Terminating TPS from these individuals may cause economic problems, with estimates suggesting removing them from the US will cost taxpayers more than $3 billion and a loss of $45 billion in GDP over a decade.
4) The Philippines (4 per cent)
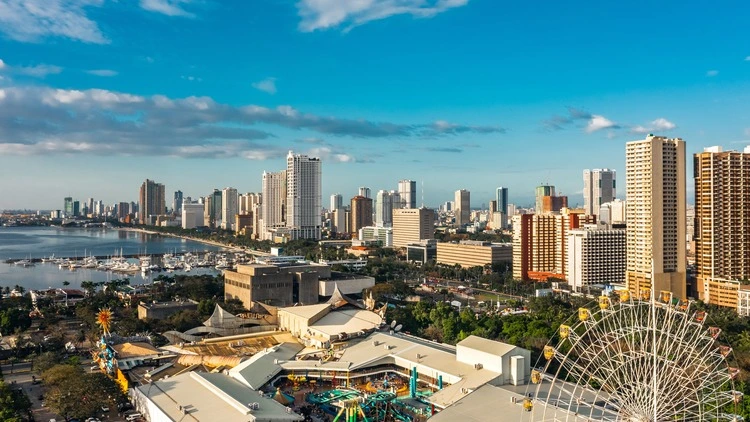
The US is home to the largest number of Filipino immigrants in the world, sitting at two million – followed by Saudi Arabia (645,000), Canada (634,000), the United Arab Emirates (565,000), Australia (286,000), and Japan (275,000).
The majority of the Filipino immigrant population resides in California (42 per cent), followed by Hawaii (six per cent) according to data between 2017-2021. Collectively, Texas, Illinois, Nevada and New York comprise 19 per cent of the Filipino population.
Filipino immigrants tend to be older than the overall foreign and US-born populations with a median age of 52 compared to 47 for all immigrants, and 37 for US-native born. This is largely due to the disproportionate number of elderly Filipinos in the Philippines: Twenty-six per cent of Filipinos are 65 or older, compared to 17 per cent of the overall foreign and native-born populations.
3) China (5 per cent)

The US is the top destination for Chinese immigrants worldwide, with Canada (930,000), South Korea (803,000), Japan (776,000), Australia (764,000), and Singapore (514,000) following suit.
Around half of Chinese immigrants live in California (32 per cent) and New York (19 per cent).
While the migration of Chinese immigrants peaked in 2019, factors including restrictions on migration by the Trump administration, tighter US visa rules for students and foreign workers during the pandemic, along with strict ‘zero-COVID’ policies on travelling from the Chinese government, caused numbers to drop.
Now, around 2.5 million Chinese immigrants live in the US, with the majority of foreign students enrolled in US higher education coming from China.
2) India (6 per cent)

After the United Arab Emirates, the US is the second-top location for Indian immigrants to move to, with approximately 2.8 million Indians residing in the US, according to recent data. Over the last four decades, the Indian immigrant population has increased significantly, in the country increasing fivefold from 1980 to 2000 before tripling from 2000 to 2023.
More than 50 per cent of the Indian immigrant population live in just five states: California (20 per cent), Texas (11 per cent), New Jersey (10 per cent), Illinois (6 per cent) and New York (6 per cent).
Recent data has shown that the rate at which Indians in the US participate in the labour force is higher than both native populations, and the overall foreign-born population. In 2023, 74 per cent of Indian immigrants aged 16 or older were in the labour force, compared to 67 per cent of all immigrants and 63 per cent of the native US population.
1) Mexico (23 per cent)
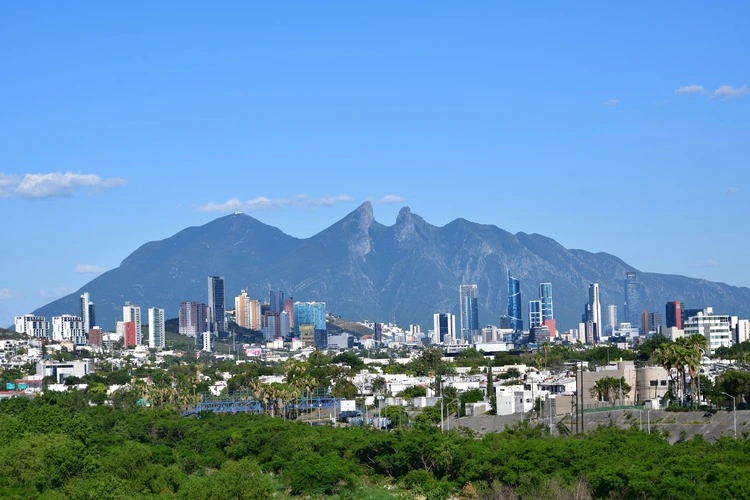
At number one is Mexico – according to 2022 data, around 10.6 million immigrants living in the US were born in the country. Around 60 per cent of Mexican immigrants live in California (36 per cent) or Texas (22 per cent), with other top states including Illinois (around six per cent) or Arizona (around five per cent).
The US is the most popular destination for Mexican immigrants, followed by Canada (87,000), Spain (61,000), Germany (20,000), and Guatemala (19,000).
However, between 2005-2014, this trend dipped as the rate of Mexicans leaving the US overtook the number of Mexican immigrants arriving. This was due to a range of factors including strengthening US immigration enforcement and the 2008 financial crisis.
Similarly to all immigrant adult populations, Mexican immigrants are more likely to be in the labour force (68 per cent) compared to their US-born counterparts (63 per cent).