Can we map our way out of future water shortages? A new tool is helping scientists identify areas where demand exceeds supply
The world is facing an impending water crisis. Due to a burgeoning global population and its ever-growing demands, water consumption has soared to eight times what it was just over a century ago. Every year, we extract an estimated 4,000 cubic kilometres of fresh water – enough to fill a tenth of the Grand Canyon, or 150 million Olympic-sized swimming pools. We consume it in our kitchens and bathrooms, in factories and power plants, and (more than anything else) we use it to irrigate our crops. In some parts of the planet, the demand is far greater than rivers or groundwater sources can sustain.
‘One example that always speaks to me is the Aral Sea,’ says Niko Wanders, a hydrologist at Utrecht University in the Netherlands. ‘More than 20 years ago, it was a big inland sea, fed by rivers.’ Years of unsustainable groundwater pumping for extensive cotton crop irrigation dried out those rivers, he explains. ‘Now just 15 per cent of the Aral Sea is left.’
The Aral Sea is a clear visualisation of what’s commonly called the ‘water gap’ – the difference between the amount of water needed and the available supply – and what happens when that gap goes unaddressed. According to Wanders and his colleague Marc Bierkens, also a hydrologist at Utrecht University, water gaps can be found in an increasing number of places. With support from the National Geographic Society and GIS mapping specialists Esri, the researchers have now developed a new tool to identify where and why these gaps are emerging: the World Water Map.
The map accounts for every drop of water in the world, using 40 years of hydrological data – including information on rainfall, temperature, soil type, land use and water use – to track water droplets wherever they fall until they finally reach the ocean, one way or another. All this information goes into a global model developed by Utrecht University researchers that’s used to map global freshwater availability and identify hotspots – areas and communities where demand is dangerously outpacing the replenishable supply.
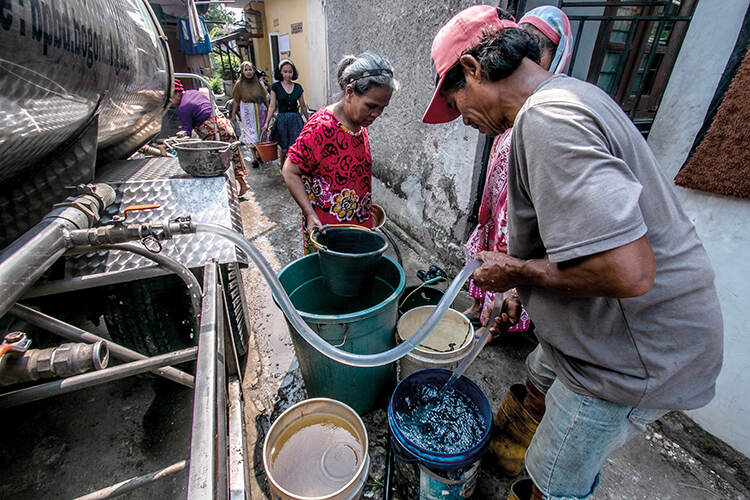
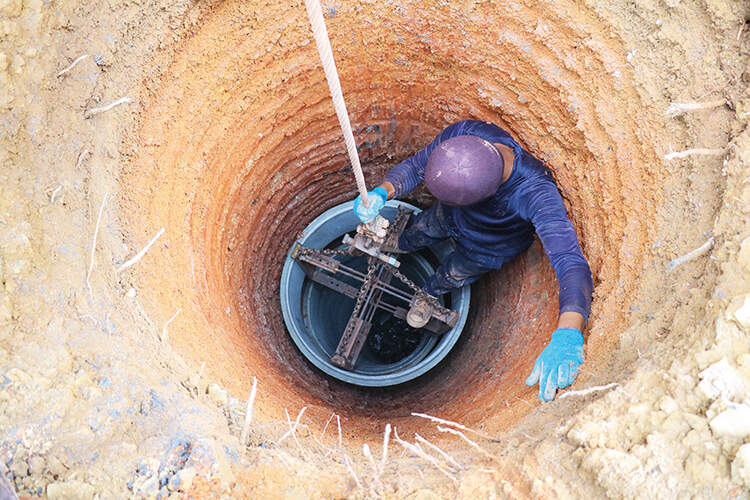
One hotspots is Mexico City, where 23 million people are currently living on water borrowed from the past. Two-thirds of the city’s supply comes from wells, which draw up groundwater from the increasingly depleted aquifer below; it’s estimated that 70 per cent more water is extracted annually than flows back into the ground. As a result, the city is sinking at a rate of almost 50 centimetres per year, damaging tens of thousands of homes as well as critical infrastructure. Meanwhile, around 30 per cent of residents lack a reliable water supply.
Mexico City is one of 21 global hotspots identified by the World Water Map. Others include the Indonesian island of Java, where extensive subsidence caused by groundwater over-extraction is threatening to swallow the sprawling capital, Jakarta, and the North China Plain, where water shortages caused by the high demand of industrial cities such as Beijing and Tianjin have worsened due to climate change and environmental damage (across the country, an estimated 80–90 per cent of groundwater is unfit for drinking). Overuse isn’t the only problem, explains Bierkens. ‘We’re also polluting the water we use.’
Water shortages may look like regional issues, but the reality is that a water gap in one place can have a big impact on globally connected food and goods markets. California, one of two US hotspots, grows 80 per cent of the world’s almonds – an estimated 70 per cent of this water-intensive crop is then exported worldwide.
21 PLACES WHERE WATER DEMAND OUTSTRIPS SUPPLY
California’s Central Valley (USA), High Plains (USA), Mexico City, Coastal Peru, Central Chile, Spain, Italy, Greece, Turkey, Iran, Indus River Valley (Pakistan and India), North China Plain, Nile Delta (Egypt), White Nile (Sudan), Arabian Peninsula, Ganges (India), Thailand, Japan, Vietnam, Java (Indonesia), Murray-Darling Basin (Australia)
Source: The World Water Map
The World Water Map has also helped researchers identify key drivers of water demand, such as agriculture. Estimates vary, but it’s thought that we currently use between 70 and 90 per cent of the planet’s freshwater to grow our food. The amount of land used for irrigated fields, which consume the most water, has doubled worldwide over the past 50 years as populations have soared.
However, the fastest-growing demand comes from domestic water use, something the researchers suggest could be controlled with greater ease. While two billion people still lack a safe water supply in their homes, Americans use 30 per cent of the US total to water their lawns, and the average home wastes 35,000 litres a year just in leaks. The creators of the World Water Map hope that the interactive tool will be used by communities to understand their water use and to prompt action where needed. ‘At each hotspot, we can use it to see what local solutions are being tried, so that policymakers and scientists can learn from each other,’ says Bierkens.