• Skip to main content
  • Skip to secondary menu
  • Skip to primary sidebar
  • Skip to footer
Geographical

Geographical

Official magazine of the Royal Geographical Society (with IBG)

  • Home
  • Briefing
  • Science & Environment
  • Climate
    • Climatewatch
  • Wildlife
  • Culture
  • Geopolitics
    • Geopolitical hotspots
  • Study Geography
    • University directory
    • Masters courses
    • Course guides
      • Climate change
      • Environmental science
      • Human geography
      • Physical geography
    • University pages
      • University of Aberdeen
      • Aberystwyth University
      • Cardiff University
      • University of Chester
      • Edge Hill University
      • The University of Edinburgh
      • Oxford Brookes University
      • Queen Mary University of London
    • Geography careers
      • Charity/non-profit
      • Education & research
      • Environment
      • Finance & consulting
      • Government and Local Government
    • Applications and advice
  • Quizzes
  • Magazine
    • Issue previews
    • Subscribe
    • Manage My Subscription
    • Special Editions
    • Podcasts
    • Geographical Archive
    • Book reviews
    • Crosswords
    • Advertise with us
  • Subscribe

New graphics reveal global air pollution trends across major cities

17 September 2024
4 minutes

Skyline of Bangkok with heavy smog/P2.5 dust.
The skyline of Bangkok covered in smog. Image: Shutterstock

Discover the ‘air quality stripes’ of major cities in all corners of the globe, revealing pollution trends since the Industrial Revolution


By Victoria Heath

For the first time, scientists have graphically illustrated air pollution trends of a major air pollutant known to affect human health, across every capital city of each nation worldwide.

Inspired by the climate warming stripes images, researchers at the University of Leeds, the University of Edinburgh, North Carolina State University, and the UK Met Office created an illustration to plot the trends in outdoor concentrations of particulate matter – a mixture of tiny liquid or solid particles including soot, dirt, dust or smoke – found in the atmosphere.

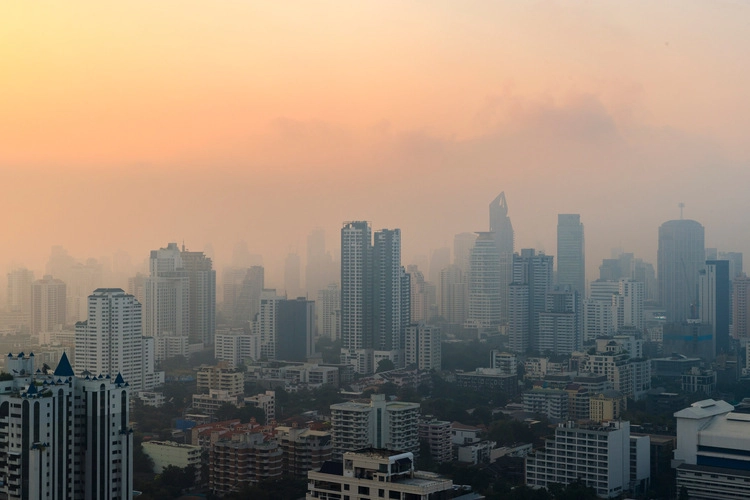
This particulate matter – also known as PM2.5 – can come both from natural sources such as volcanoes and deserts but is also produced by human activities, including cars, climate change-induced fires and domestic burning. Inhaling PM2.5 can cause breathing problems and an increased risk of developing cancer and many other diseases, from Alzheimer’s to diabetes.

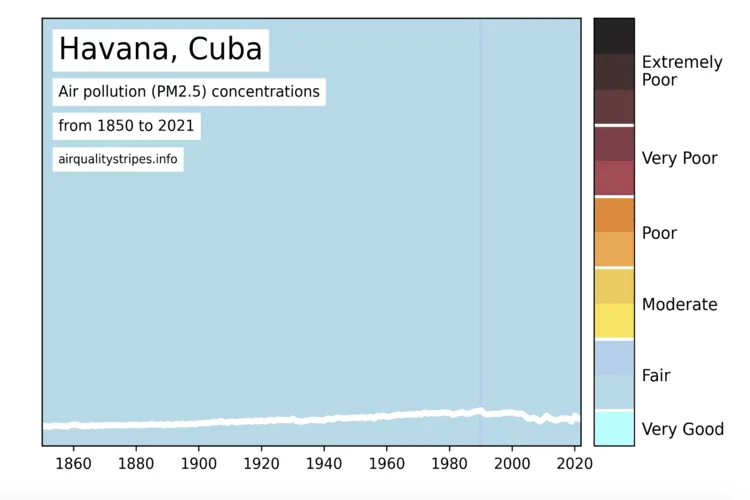
South America & North America air pollution trends

Sao Paulo Brazil air quality stripes graphic
Image: University of Leeds

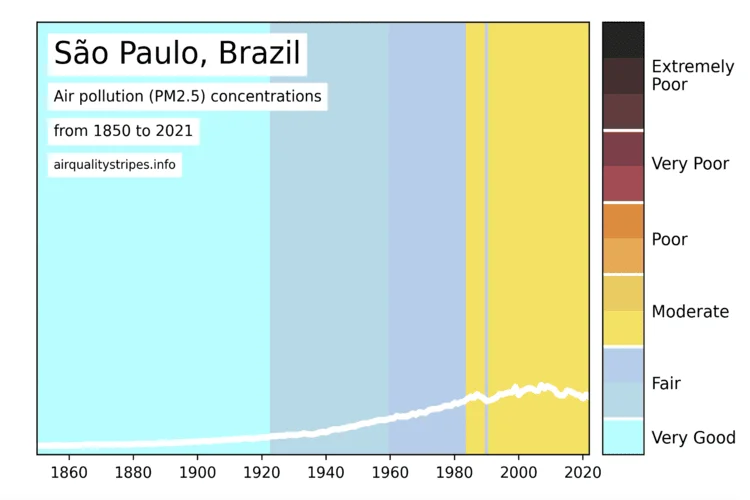
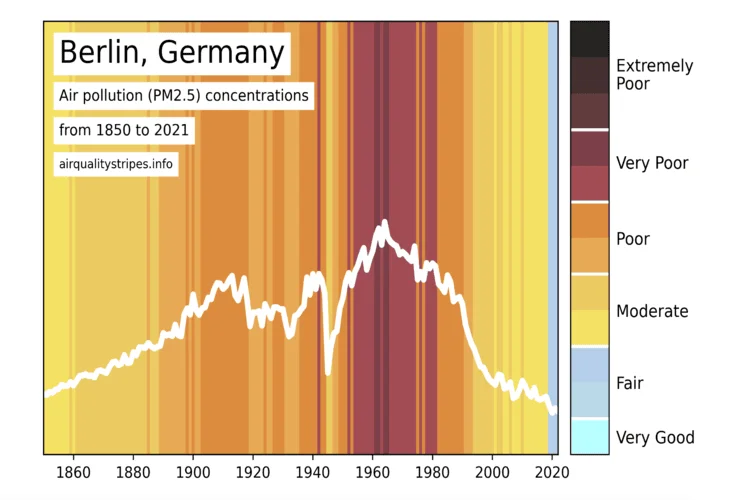
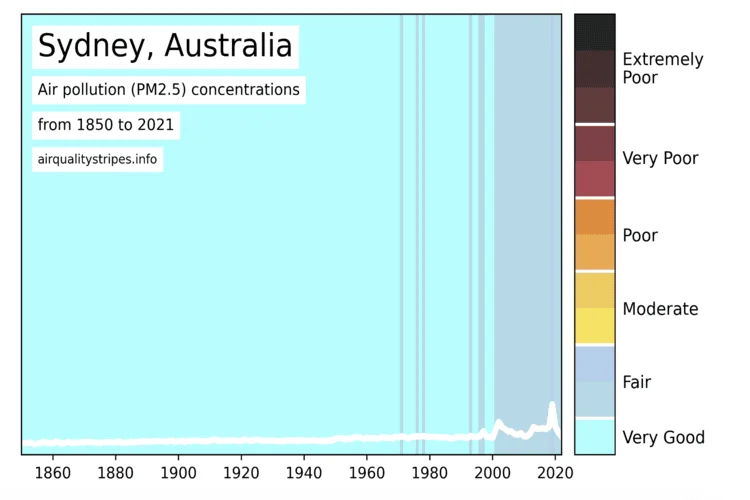
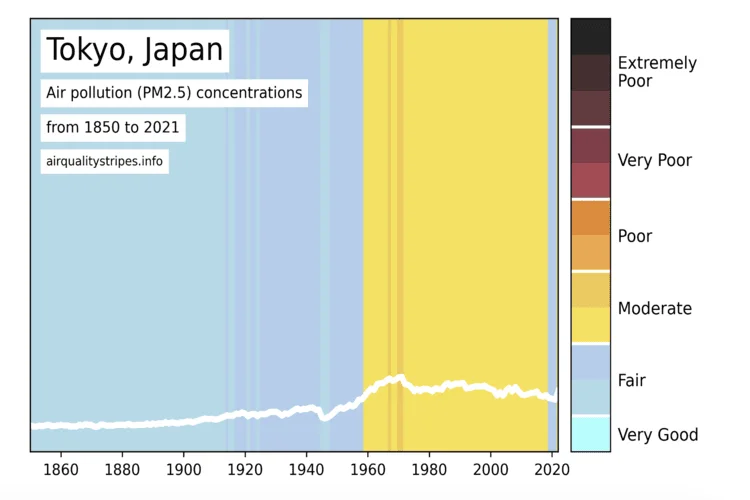
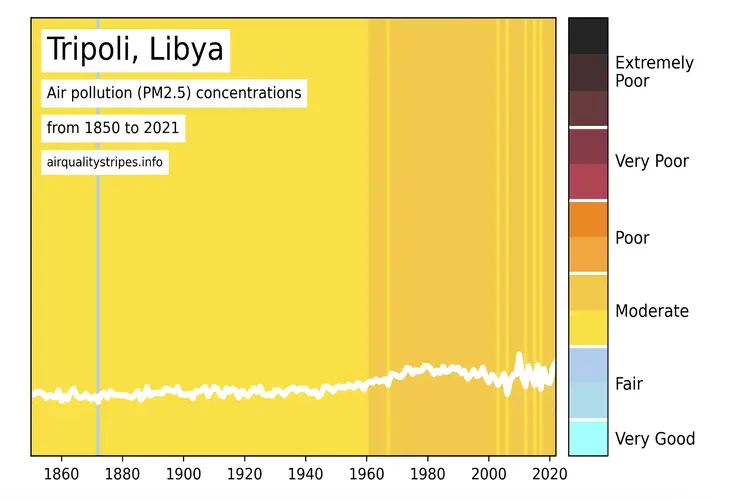
The lightest stripes in the graphics illustrate pollution levels that meet the World Health Organisation Air Quality Guidelines – introduced in 2021 – and all other colours exceed these guidelines.

Using data from computer simulations and satellite observations, researchers were able to track global air pollution trends from the beginning of the Industrial Revolution. The study found that a substantial reduction in particulate matter across most of Europe – especially Western Europe – due to stricter air quality regulations and technological advancements.

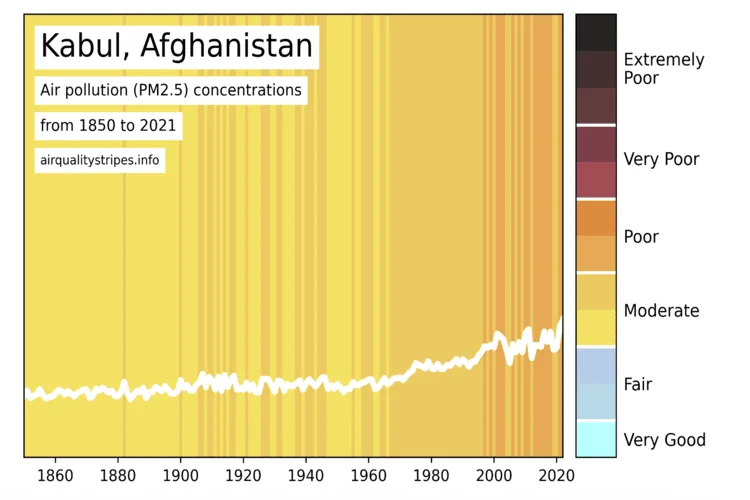
Elsewhere, in Central Asia and Africa, air pollution is worsening due to rapid urbanisation, industrial growth and limited regulations.

‘The images show that it is possible to reduce air pollution; the air in many cities in Europe is much cleaner now than it was 100 years ago, and this is improving our health, said co-director of the project Dr Kirsty Pringle. ‘We really hope similar improvements can be achieved across the globe.’

Havana, Cuba air quality stripes graphic
Image: University of Leeds

The WHO recommends that he annual average concentration of PM2.5 should not exceed a concentration of 5 micrograms per cubic meter air (5 ug/m3). Currently, 99 per cent of the world’s population live in areas that have concentrations above this.

Fairbanks USA air stripes quality graphic
Image: University of Leeds

Europe

Berlin, Germany air stripes quality graphic showing air pollution trends.
London UK air stripes quality graphic showing air pollution trends.
Image: University of Leeds
Kyiv Ukraine air quality stripes graphic
Image: University of Leeds

Australia & Oceania

Sydney Australia graphic showing air pollution trends.
Wellington New Zealand air stripes quality graphic

Asia

Kabul Afghanistan air quality stripes graphic showing air pollution trends.
Riyadh Saudi Arabia air quality graphic
Image: University of Leeds
Tokyo Japan air quality stripes graphic
Beijing China air stripes quality graphic showing air pollution trends.

Africa

Lusaka Zambia air stripes quality
Image: University of Leeds
Tripoli Libya air quality stripes graphic
Image: University of Leeds
Kigali Rwanada air quality stripes image.
Image: University of Leeds

To see further images of global air pollution trends, visit the Air Quality Stripes webpage here.

Related articles:

  • Two thousand children a day die from air pollution
  • Can artificial rain dampen Delhi’s toxic air?
  • Only seven countries in the world had healthy air quality in 2023
  • Approval to expand London City Airport faces criticism
  • Canada wildfires continue to rage, affecting air quality in the USA

Filed Under: Briefing

Protected by Copyscape

Primary Sidebar

Subscribe to Geographical Magazine from just £4.99

Geographical subscriptions

Sign up to our newsletter and get the best of Geographical direct to your inbox

Popular Now

June 2025 Geographical crossword

June 2025 Geographical crossword

Out now: June 2025’s Geographical Magazine

Out now: June 2025’s Geographical Magazine

Concept art of chinese flag and stocks

China: Debt, demographics and a manufacturing slowdown

Odysseus tied to the mast. Image from an ancient vase found in the Black Sea

Mapping the myth: In search of Homer’s enchanted islands

QUIZ: Weather

QUIZ: Weather

Footer

  • Facebook
  • Instagram
  • LinkedIn
  • Reddit
  • TikTok
  • Twitter
  • YouTube

Geographical print magazine cover

Published in the UK since 1935, Geographical is the official magazine of the Royal Geographical Society (with IBG).

Informative, authoritative and educational, this site’s content covers a wide range of subject areas, including geography, culture, wildlife and exploration, illustrated with superb photography.

Click Here for SUBSCRIPTION details

Want to access Geographical on your tablet or smartphone? Press the Apple, Android or PC/Mac image below to download the app for your device

Footer Apple Footer Android Footer Mac-PC

More from Geographical

  • Subscriptions
  • Get our Newsletter
  • About Us
  • Contact Us
  • Advertise with us
  • Privacy policy
  • Terms & Conditions

Copyright © 2025 · Site by Syon Media